Dam and Pond Map Viewer
Help Guide

![]()
|
1. Dam and
Pond Map Viewer
Disclaimer Popup
When loading the story map
application, content on the page will not be accessible before reading and
accepting the disclaimer popup. Clicking the “I Accept” button will close the
disclaimer and allow you to continue to use the story map. Clicking the “I
Decline” button will close the disclaimer and map viewer application. The
terms and conditions must be accepted before any further use of the site can
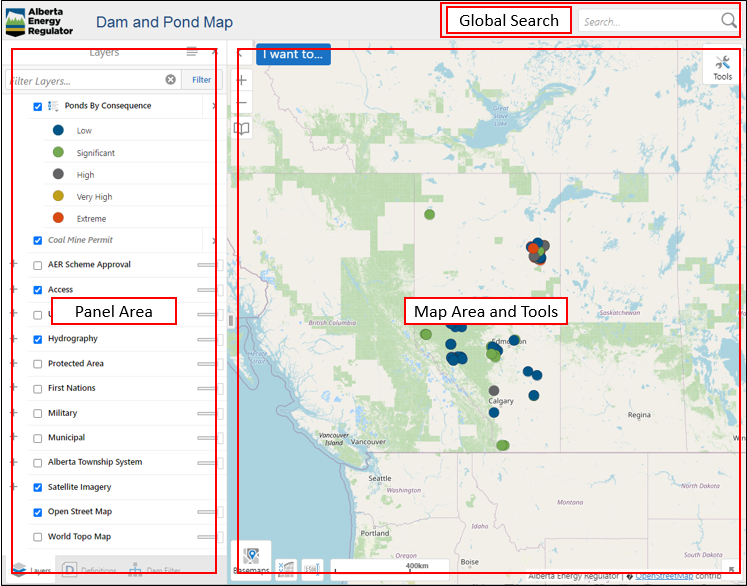
be attempted. Overview
The image below shows an overview of the dam safety map
viewer application. You will see that it is divided into three different
sections: ·
Global
Search ·
Panel
Area ·
Map
Area and Tools Global Search
Enter
a value to search by in the global search bar and press the enter key. Any
results returned from your search will appear in the Panel Area. Panel Area
The Panel Area contains
various panels that provide additional map functionality. For example,
the Layers panel lists all available map layers that can be
displayed on the map. When you click on different panels, the content in
the Panel Area changes to show information related to the
panel selected. By default, there are three panels visible when the map viewer
loads: Layers,
Definitions and Dam Filter. Other panels are added to
this area when tools and links are used in the viewer.
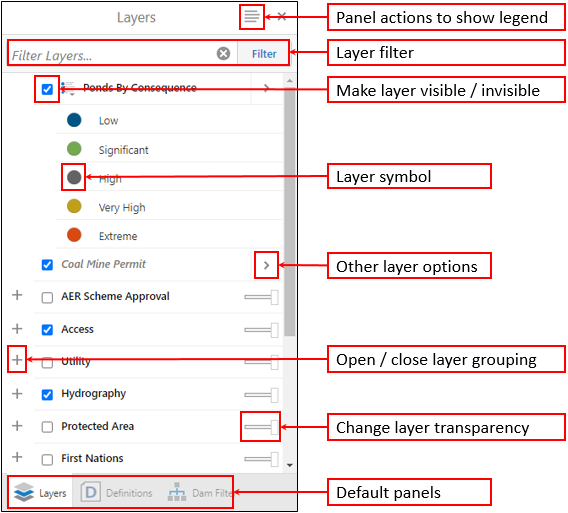
The Layers panel lists all the available map layers and provides the following functionality: ·
Click
the plus or minus symbols to open or close a layer grouping. ·
Click
the check box to make a layer visible or not visible on the map. ·
Click
and drag the slider to change the transparency of the layer. ·
Click
the arrow to the right of a layer to see options for zooming.
This panel contains definitions
for all terms used in the dam safety map viewer. Dam
Filter Panel
This panel is used to
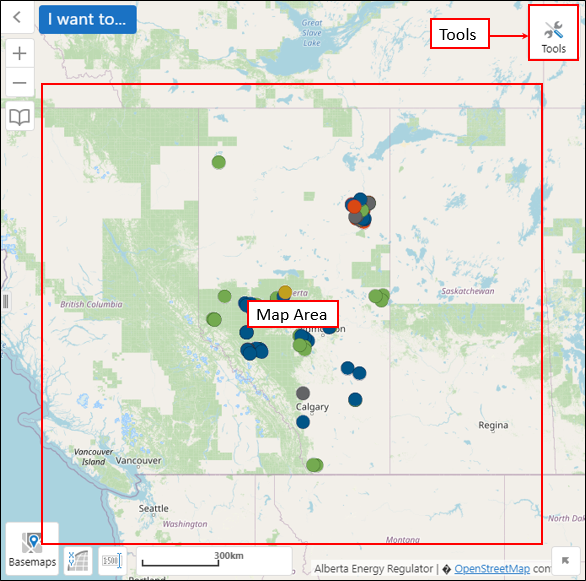
filter dams on the map. Map Area and Tools
The
Map Area displays a collection of layers
containing different shapes, colours, and symbology that show spatial
information relating to the dam safety map. This area also contains basic
navigation tools to help you interact with the map. The Tools toolbar on the top right side of the map area holds
additional tools that can be used to perform a variety of different tasks.
Open it by clicking on the Tools
button.
Map Area
The
map area contains different tools and functionality to help you explore the
spatial data on the map. Your mouse can control various types
of actions, including the following: ·
Use
the mouse scroll button to zoom in and out of the map. ·
Double
click an area of interest on the map to zoom in to that location. ·
Pan
around the map by clicking on an area of interest and holding the left mouse
button. Then drag your mouse left, right, up, or down to pan the map in that
direction (this can also be done by clicking and holding the mouse scroll
button, then moving your mouse). ·
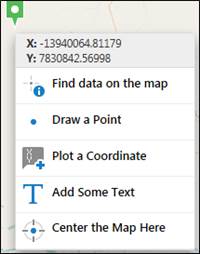
Right
click an area on the map to bring the mouse context menu to: o
Find
data on the map using the Identify tool. o
Draw
a point on the map using the Draw tool. o
Plot
a coordinate on the map in this location using the Plot a Coordinate tool. o
Add
some text to the map in the area of interest. o
Centre
the map on the area of interest clicked on the map.
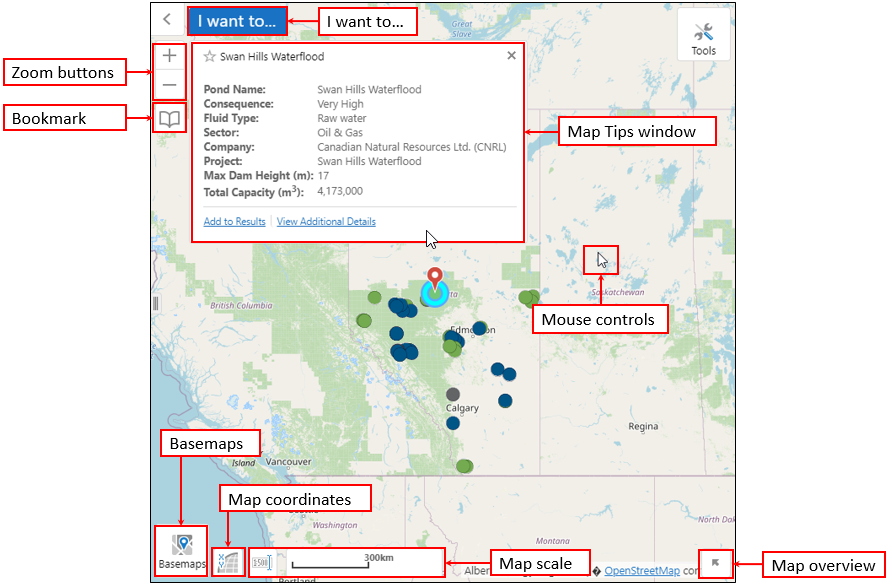
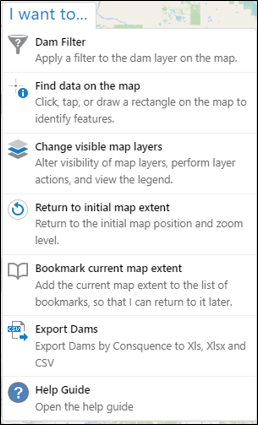
I Want To…
This menu provides quick access to
tools also available from the Tools menu. These include: ·
Apply
a filter to the dam layer on the map using the Dam Filter tool. ·
Find
data on the map using the Identify tool. ·
Change
visible map layers from the Layers panel. ·
Return
to the initial map extent. ·
Bookmark
the current map extent. ·
Export
Dams by Consequence to Xls, Xlsx, and CSV file
formats. ·
Open
the help guide.
Zoom Buttons
To
view an area on the map in more detail, click on the
Map Tips Window
Basemaps
Click
on the select basemaps button to choose which basemap to display on the map. Options for basemap display are Open Street Map and World Topographic
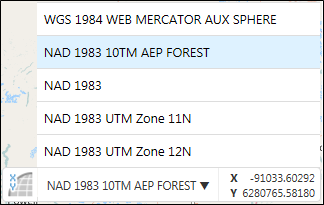
Map. Map
Coordinates
Click
on the map coordinates button to open the widget menu. Map coordinates are
displayed as geographic latitude and longitude decimal degrees in the WGS
1984 Web Mercator Auxiliary Sphere coordinate system. These values update
dynamically as the mouse moves around the map area on the screen. It is also
possible to change the coordinate system by clicking on the arrow icon
beside the coordinate system.
Map
Scale
Click
on the map scale input box button to open the widget menu. Here you have the
option to choose a scale from a dropdown menu to zoom to, or to manually
input your own map scale by clicking inside the scale box and clicking the go
button.
Scale Bar
The
scale bar shows measurements for distances in both metric and imperial units.
The scale bar considers projection distortion and dynamically adjusts based
on the zoom level of the map. Click on the overview map button to view an overview of
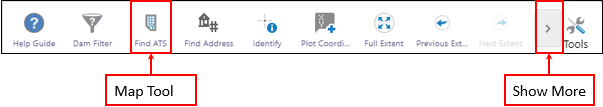
the current map extent. Tools
The Tools toolbar is located on the top right side of Map Area. Clicking on the tools
button will open the toolbar, allowing you to click on the tool you would
like to use. Additional tools in the toolbar can be found by clicking on the
arrow buttons.
Help Guide
This tool opens this
help guide.
Dam Filter This
tool opens up the dam filter panel in the Panel Area and allows you to filter dams on the map by company,
sector, consequence, and fluid type.
Find ATS (Alberta Township System)
This tool
opens up the Go to ATS panel in the Panel
Area and allows you zoom to a section or township based on the Alberta
Township System, a grid network that divides the province into parcels of land.
Enter the Section (S), Township (T), Range (R), and Meridian (M) that you'd
like to search for. If no section is specified, then the tool will zoom to
the Township.
Find Address
This tool
opens up the Find Address panel in the Panel
Area and allows you to find and zoom into an
area of interest on the map using an address. A postal
code might be required for rural addresses in order to perform the search. Results
are sorted based on score, and only results with a high matching score will
be shown. The score helps determine how close the returned address is to the
one entered into the tool.
Identify
Identify
features by drawing a rectangle over an area on the map. All the features
beneath the shape drawn are listed in the Results Table.
Plot Coordinates
This tool
opens up the Plot Coordinates panel in the Panel Area and allows the plotting of coordinates for different
areas on the map.
Full Extent
Zooms to the full extent of the map.
Previous Extent
Zooms to the previous extent of the map.
Next Extent
Zooms to the extent of the map before clicking the
previous extent tool.
Point
Draws
a point graphic on the map on the area clicked on the map. Clicking the arrow
will reveal other draw tools that can be used to draw graphics on the map. Distance
Measure
distances on the map by drawing a segmented line. Click once to start drawing
a line. Click again to start drawing a new line segment. Double click to
finish drawing the line. Clicking the arrow will reveal the option to measure
an area on the map. To
measure an area of the map by drawing a shape, click once to start drawing a
line and click again to start drawing a new line segment. Double click to finish
drawing the line, and the area inside the lines will be drawn.
Clear
Erase all drawing or measurement graphics on the map.
Print
This
tool opens up the Print Map panel in the Panel
Area and allows you to print an area of interest on the map. Options to
select layout, output format, grid size, map scale, and to add author and
title information are available from the panel. Export Dams
This tool opens up the Export Dams by
Consequence panel in the Panel Area
and allows export the dams by consequence data to an Excel .xlsx, .xls, or CSV format with a customized file name. 2. Map
Viewer Functionality
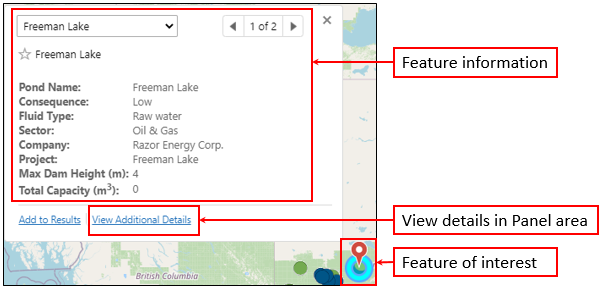
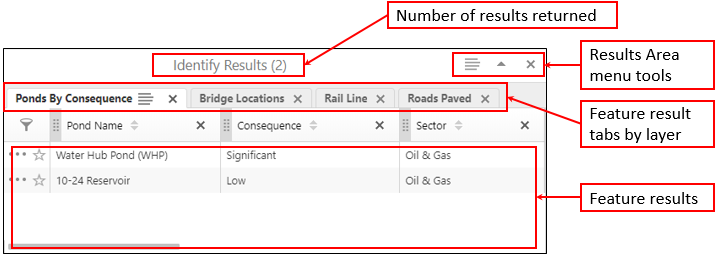
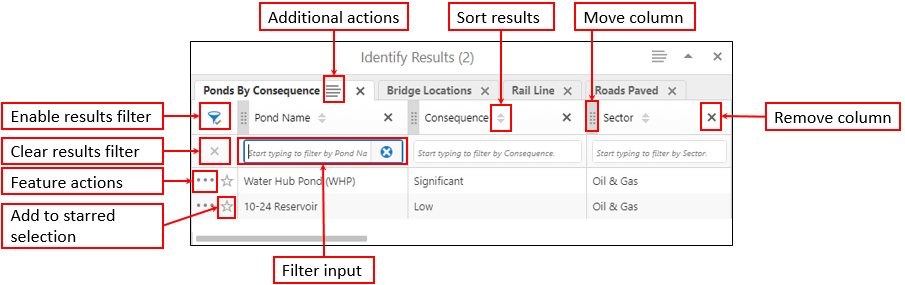
Results Area – Table Format
When features are identified
on the map, they appear in a results table at the bottom of the Map Area. Results are grouped based
on the layers available in the map viewer, with each grouping represented as
a tab. Clicking on each tab will change the features shown in the results
area, and only the results relating to that layer will be shown in the table
and on the map.
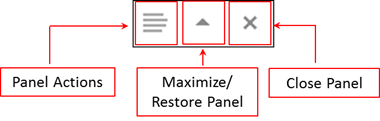
On the top-right corner
of the results table are additional tools to change how the results are
viewed.
· The Panel Actions menu
provides the following options: o Switch to a List – Select this option to move
the results into the Panel Area. o Show Buffer Options – Use this tool to identify
other features near these results on the map. · The Maximize/Restore Panel option will maximize the results frame to cover the
entire Map Area. Clicking the icon again will change it back to
its original size. · The Close Panel option
will close the results area. In some cases, a search may generate
a large number of results. In these cases, results can be filtered or sorted using
a variety of tools available in the results table.
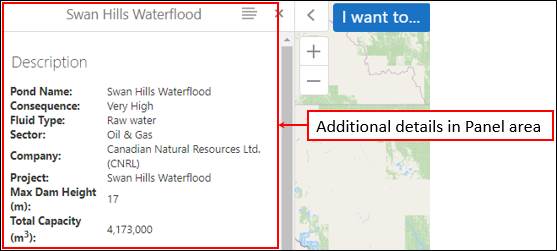
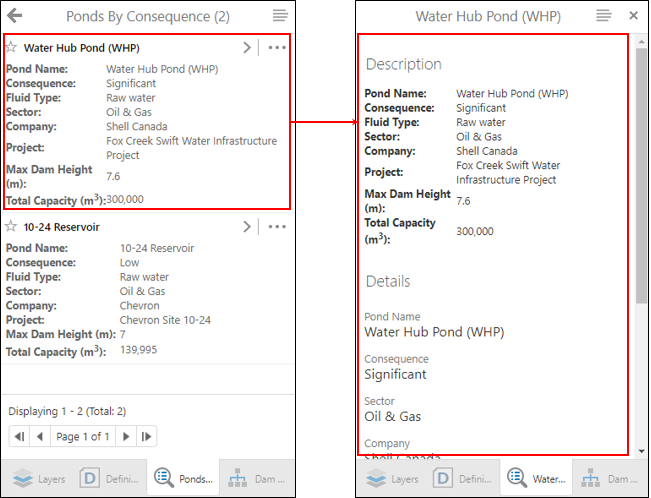
Results Area – List Format
Switching to the list format will list the
results in the Panel Area. Click on a feature in the list to view
more information about it. This information will also appear in the Panel
Area.
3. Map Viewer
Information
Consequence Definition Table
|
||||||||||||||||||||||||||||||||||||||||||||