|
|
|||||||||||||||||||||||||||||||||||||||||||||||||||||||||||||||||||||||||||||||||||||||||
|
|
AER Scheme Approval Area Map Viewer
|
||||||||||||||||||||||||||||||||||||||||||||||||||||||||||||||||||||||||||||||||||||||||
|
|
|||||||||||||||||||||||||||||||||||||||||||||||||||||||||||||||||||||||||||||||||||||||||
|
Description of Available
Information |
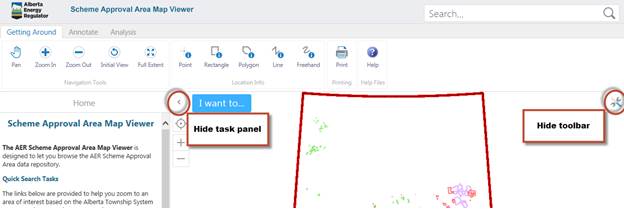
Increasing the
size of the map
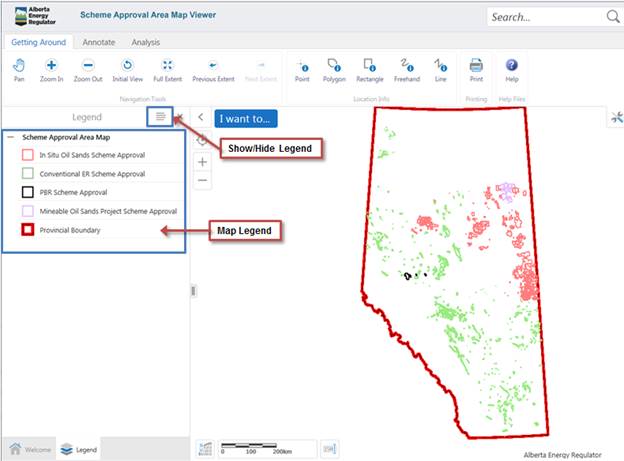
When initially loading the map viewer, the
toolbar and home panel are displayed for faster access to tools. If you would
like to have a larger map area to view, you can use the two buttons
highlighted in the picture to hide the toolbar/task panel. These same buttons
can be used to show the toolbar/task panel when they are hidden.
The Scheme Approval Area
Map Viewer is a web-based application developed to provide
access to conventional enhanced recovery (ER) scheme approval areas, in situ
oil sands scheme approval areas, and mineable oil sands scheme approval areas
in a spatial environment. The map viewer shows approval areas for active
conventional ER scheme approvals, in situ oil sands scheme approvals, and
mineable oil sands scheme approvals along with basic approval information
such as approval number, approval holder name, scheme name (if applicable),
scheme sub-type (if applicable), approval area description (if applicable),
and associated Field/Pool or Area/Deposit. All you
need to use the Scheme Approval Area Map Viewer is an Internet browser (i.e.
Internet Explorer, Firefox). When first connecting to the Map Viewer, you will
be presented with a terms of use, which you must accept in order to access
the website. Declining will redirect you away from the Map Viewer. The terms
of use can be viewed again at any time by clicking the button in the lower
right corner. Description of Available InformationThe
Scheme Approval Area Map Viewer includes the approval areas associated with
three scheme types: conventional ER schemes, in situ oil sands schemes, and
mineable oil sands schemes. Conventional ER approvals are schemes granted in
accordance with Section 39 of the Oil and Gas Conservation Act. In Situ Oil
Sands and Mineable Oil Sands approvals are schemes or operations granted in
accordance with Sections 10 and 13 of the Oil Sands Conservation Act. The type of conventional ER and in situ oil sands
schemes can be identified using the scheme sub-type attribute. The scheme
sub-types for conventional ER schemes include, but is not limited to, waterflood, chemical, and miscible –hydrocarbon. The
scheme sub-types for in situ oil sands schemes include, but is not limited to, commercial steam-assisted gravity
drainage (SAGD), commercial cyclic steam stimulation (CSS), and enhanced
recovery schemes within the oil sands areas. For
ease of reference of oil sands scheme approval areas, a data layer is
provided for the Oil Sands Areas which include the Athabasca, Peace River,
and Cold Lake Oil Sands Areas defined by Order No. OSA 1, Order No. OSA 2,
and Order No. OSA 3, respectively. The oil sands surface mineable area (SMA)
is also available for viewing. The SMA is described in ST-98-Alberta’s Energy
Reserves and Supply/Demand Outlook. The Scheme Number attribute is the approval
number
specified on the official approval document. Each scheme has a unique
approval number. The alpha suffix associated with the approval number (e.g.,
the “N” in 8558N) identifies that latest approval amendment associated with
the scheme approval. The Approval Holder attribute identifies the
company name who is the holder of the approval. The approval holder is the
corporate entity responsible for the scheme operations. The Field/Area and Pool/Deposit attributes
identifies the entity in which production/injection data for a scheme is reported
to through the Alberta Petroleum Registry of Alberta (PRA). Conventional ER
schemes report production and injection data to a Field and Pool and oil
sands schemes report production to an Area and Deposit. The production
Field/Pool could differ from a geological Field/Pool in the situation where
production from more than one geological pool is commingled. In this case,
production is reported to a commingled pool at the PRA. A list of geological
pools which comprise a production commingled pool can be found in the
Commingled Pool List available on the AER web site. In the case of commingled
production, a user is encouraged to obtain a copy of the conventional ER
approval document to identify the geological pool(s) under enhanced recovery. The Approval Area Description attribute helps
describe the approval area associated with a scheme approval. For example,
commercial in situ oils sands scheme approval areas often have two approval
areas: one for a project area and one for a development area. In cases where
approvals have multiple areas, a user should consult the official approval
document itself for more information on each area. The Scheme
Approval Area Map Viewer is an ArcGIS Server GIS application. The map viewer is
intended to increase the visibility and accessibility of the location of
these types of scheme approval areas. Only basic information associated with
the scheme approval is provided. Users should obtain a complete copy of the
approval document itself for further information. The map viewer includes functionality to
search and identify scheme approval areas using basic information including
scheme number, approval holder, scheme name (if applicable), production Field/Area,
and production Pool/Deposit. Basic map navigation tools such as zooming and
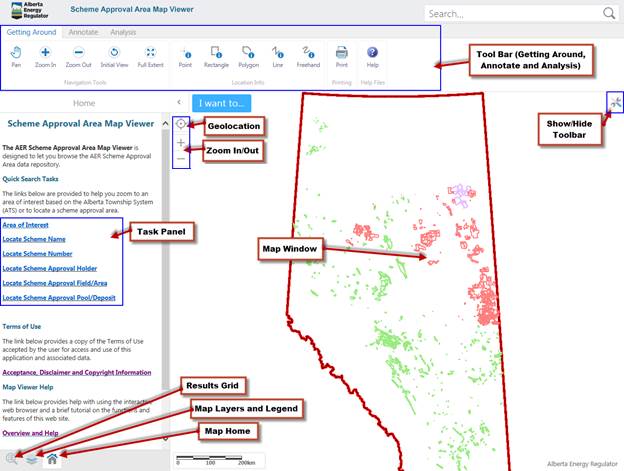
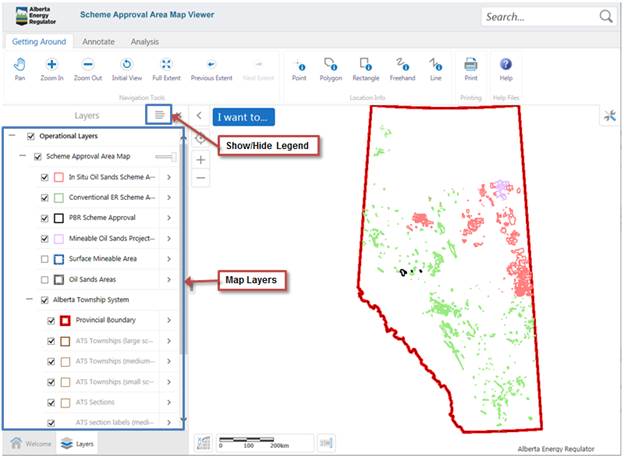
panning are provided. The basic components of the Scheme Approval Area Map
Viewer are shown in Figure 1.
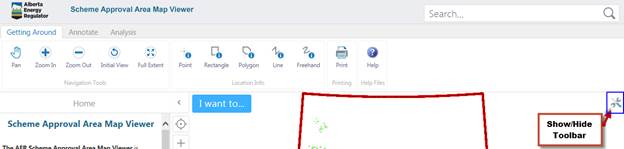
Figure 1: Components of AER Approvals and Areas Map Viewer The toggle
tool bar allows you to shrink/expand the tool bar to give you a larger working
area when needed. Getting AroundThe tool bar
contains a set of tools that let you quickly move around your map, and see
detailed information about map features.
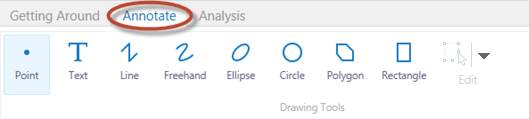
AnnotateSelect an area on the map using one of the tools below. Your report will be created once your selection is complete.
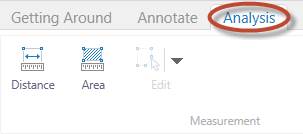
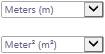
Analysis
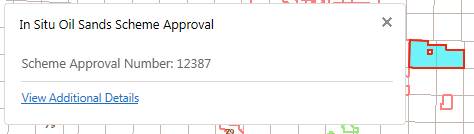
Tooltips
If no tool is
currently selected, clicking on the map will bring up a tooltip containing
information about the area selected. Clicking in another area will remove the
previous tooltip, and add a new one at the location most recently selected.
Geolocation
This button will attempt to find your current location, and display it
on the map. If successful it will zoom into the area you are located, and
highlight the area. Depending on the settings of your browser, you may get a
window pop up at the bottom of your screen. In order for this tool to work,
you must click allow. Note: This
function is only for tablets with GPS tracking ability. Zoom In/Zoom Out
Clicking the The
Map Contents Panel displays the map services available for display. The check
box next to the layer name indicates whether it is turned on or off. Clicking
this check box will toggle the layer on/off. Some layers will not be visible
at all zoom levels, indicated by the name being greyed out. In order to see
these layers, you may need to zoom in or out. When the layer name is no
longer grey, it will be visible. Pressing the Panel Actions menu button will
allow choices to show or hide the legend.
The
Map Legend Panel displays the symbology, or the legend, associated with the
map services displayed in the map window. Pressing the Show Layer List button
will hide the legend.
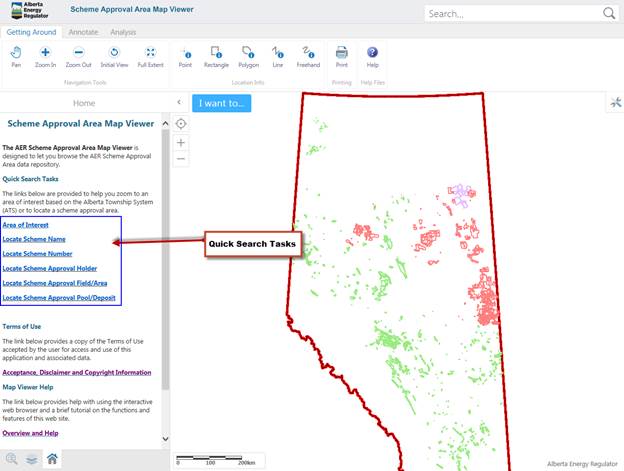
The Tasks Panel can be used to ask
questions and get answers about the geography you are exploring. Tasks are
usually more complex tools which require a user interface. Answers come back
to you in the form of new information that’s displayed appropriately in the
application. Generically, the answers are referred to as results. You create
this new information, which may be spatial or non-spatial, by carrying out
tasks. The tasks appear on the user interface grouped together in the Tasks
Panel. In the Scheme Approval Area Map Viewer,
Tasks include Area of Interest, Locate Scheme Name, Locate Scheme Number,
Locate Scheme Approval Holder, Locate Scheme Approval Field/Area, and Locate
Scheme Approval Pool/Deposit. Oil
Sands schemes report production to an Area and Deposit and Conventional ER schemes
report production to a Field and Pool. Oil Sands scheme approvals are
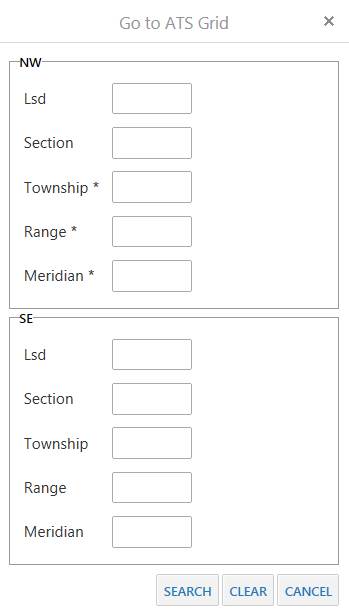
commonly referenced and identified by scheme name. Area of Interest Task
The
area of interest task allows you to zoom in the map to the area you specify.
You can use Township, Section, Quarter Section, LSD, and Meridian to specify
the area, where the values with a * are required. Choose a point for the top
left corner of the map, and a point for the bottom right corner of the map,
and finally, click the ‘Search’ button. Click on “Clear” button to reset the
selection. Click on “Cancel” button to exit the tool. After clicking the
‘Search’ button, the map will be zoomed to your area of interest. If only one
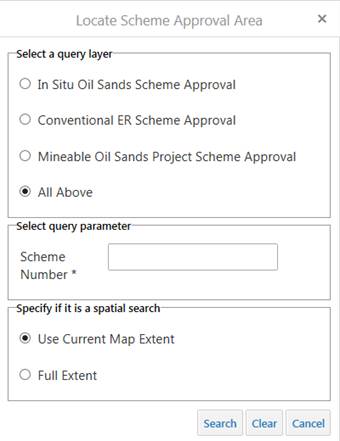
corner is entered, the map will centre on that Township/Range/Meridian. Locate Scheme TaskYou
can locate a scheme and zoom to it quickly by using the appropriate Locate
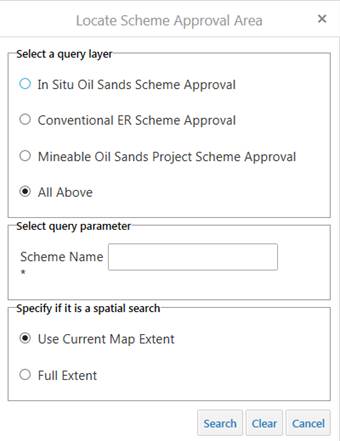
Scheme task. The
following are the steps to use these tools: 1. Click on the
appropriate Locate Scheme task
from the Quick Search Tasks area; “Locate Scheme Approval Area” will show in
a new tab on the map content window.
2. Select the type
of Scheme you are interested from the query layer radio buttons. Enter the
identifying name/number/approval holder/field or area name/pool or deposit
name. Finally select either to search in your current map extent, or from the
entire map. 3. Press the Search
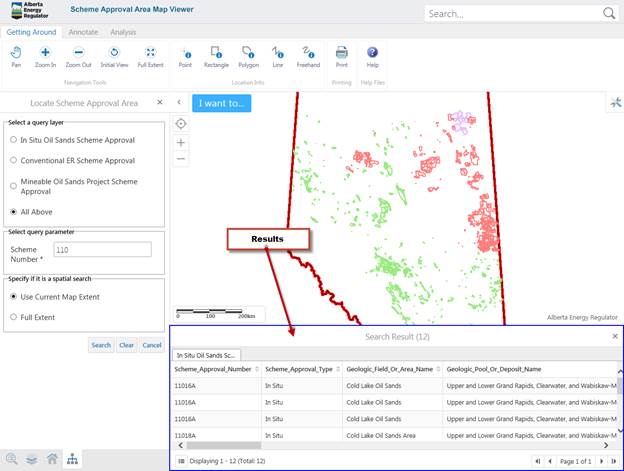
button. The
results will be displayed in the Results Grid. You can then select a result
to focus the map on that area and receive information about the area in the
Results Grid.
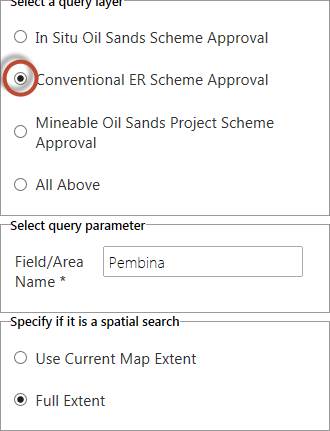
Viewing Multiple
Results If
you are querying using the “all above” layer for results, you will only be
able to select each result individually to view it on the map. If you want to
view all the results from a single layer on the map simultaneously, you must
select to query from only that layer.
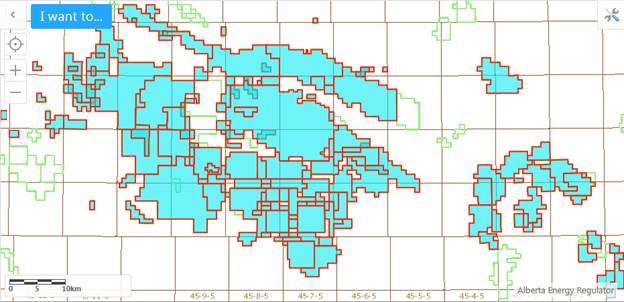
By
searching on a single layer, the viewer will highlight and zoom to all the
results from that layer.
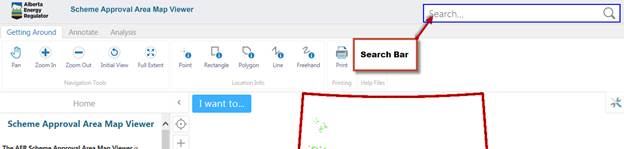
The search bar feature allows you to search
the map on a number of parameters. When using the search bar, it is
important to only search by one condition at a time. For example, only search
by name OR by owner, searching by both will result in no results. When searching by UWI, it is important to
include leading 0’s in the identifier, but it is not necessary to include the
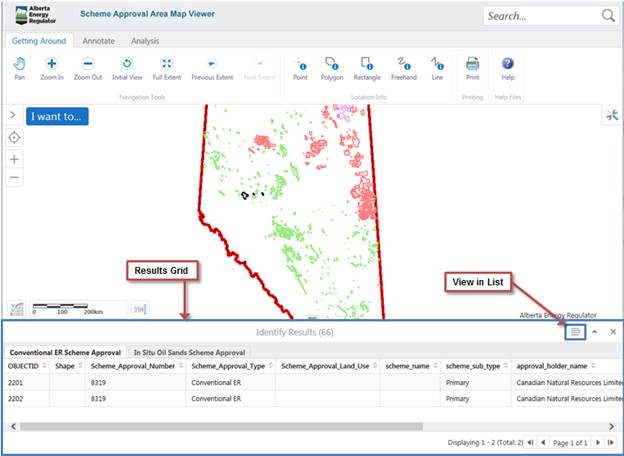
whole UWI in a search. After executing
a tool – whether using a Task in the Task Panel, or a tool from the tool bar
– the results are displayed in the Results Grid below the Map Window (not
shown in Figure 1). Results are separated into different tabs based on what
layer they belong to. Selecting a result will zoom in the map into the
selected area, and highlight the feature.
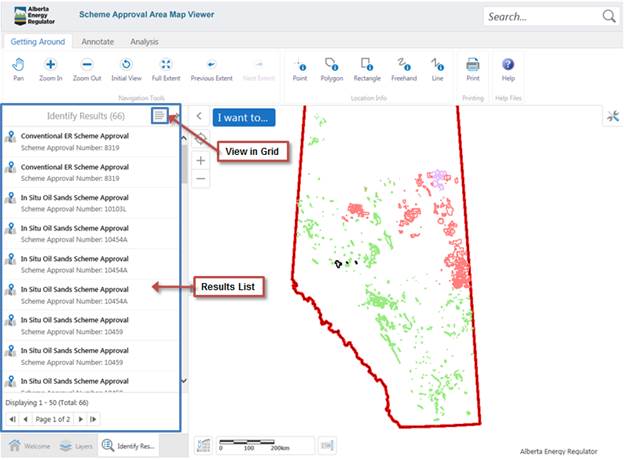
By clicking
the show in list button, the results grid will change to the list view. Clicking
the button again will return to the results grid format.
This
application uses HTML5 (http://en.wikipedia.org/wiki/HTML5) for structuring
and presenting AER geospatial data for the latest standard Internet
browsers. AER has tested compatibility with the most current stable
releases of Microsoft Internet Explorer v11, Google Chrome v34 and Mozilla
v30. Other browsers may be used (including on Tablet and
Smartphone platforms), but AER cannot guarantee that all features will work
as expected. For
technical support, please contact the Customer Contact Centre at: Email: inquiries@aer.ca Phone: 403-297-8311 option '0' |
||||||||||||||||||||||||||||||||||||||||||||||||||||||||||||||||||||||||||||||||||||||||
|
|
|
||||||||||||||||||||||||||||||||||||||||||||||||||||||||||||||||||||||||||||||||||||||||